PyMU

A need for read

About a year ago I purchased an ‘atomic IMU’ unit from Sparkfun ( for completeness, an IMU is an Inertial Measurement Unit, providing readings in (usually) >= 6 dimensions of global and angular acceleration ). Since then, I have used it in a few projects – a gyro mouse for a virtual reality headset (link), measuring the deceleration of a toy car for a physics demonstration; and as a nice test data-source for serial communication fiddling. Recently I had familiarized myself a little with the PyQt GUI framework, and was in a search for small project ideas to reinforce what I was learning – a serial reader for this device seemed adequate as it uses a few different GUI functions; real-time graph plots, buttons, timing, form input, dynamic resizing…

Stage 1. Python communication

First task was to actually get the data from the device into the computer’s memory. I’d previously done serial comms using windows sockets in C++, but I guessed that there’s probably an easier way in Python, it being the renown high-level language it is. Fortunately, a couple of minutes on Google lead me to PySerial, which was perfect. Opening the IMU was only a couple of function calls:

import serial
 
serialPort = None
 
def InitIMU(port, baudrate=115200):
    global serialPort
    serialPort = serial.Serial(port, baudrate, timeout=0.1)
    serialPort.close() #Sometimes the port needs to be closed first
    serialPort.open()
    serialPort.write('#') #Send the 'begin' signal

Yeah, I know, globals are bad. I don’t usually do this but my OOP in python isn’t fantastic so I just abused a global as a poor-man’s singleton :P. Anyway, after the IMU was open, I just read 16-bit integers, 2 bytes at a time, iterating over input readings into a custom storage class (between sentinels, this code is from inside a loop):

#Add a new, empty reading
l.append( IMUReading() )
 
#Combines 2 bytes into an integer
def ReadInt16(cnt): return 256*ord(bytes[cnt+1])+ord(bytes[cnt+2])
 
#Look at every even window to get the numbers, sticking them in the latest (empty) reading
#Couldn't really come up with a cleaner way other than just incrementing the indices
l[-1].count = ReadInt16(i);i+=2
l[-1].accel.x = ReadInt16(i);i+=2
l[-1].accel.y = ReadInt16(i);i+=2
l[-1].accel.z = ReadInt16(i);i+=2
l[-1].gyro.x = ReadInt16(i);i+=2
l[-1].gyro.y = ReadInt16(i);i+=2
l[-1].gyro.z = ReadInt16(i);i+=2

Again, nothing extravagant here, just reading data the way the IMU spec supplies them.

Stage 2: something to look at

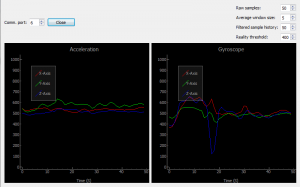
Once the serial comms were working, I moved onto the GUI. Qt Designer is good like that, dragging spacers, buttons and windows onto the screen is swift and easy. In place of where the graphs would be in the final application, I dropped QGraphicsView objects. It was then, after some research, that I realised it would be easiest to use a 3rd-party graphing library rather than going from scratch with basic plotting functions. As it turns out, most people use Qwt for this – however I wasn’t convinced of it’s real-time performance; so instead I used PyQtGraph which — although not thoroughly documented, I found easy enough to use. For example, inside my main loop, retrieving, filtering and displaying data from the IMU every frame was only a few lines:

if IMUReader.serialPort != None: data.Update()
 
accelxcurve.setData(list(data.filtered.accel.x))
accelycurve.setData(list(data.filtered.accel.y))
accelzcurve.setData(list(data.filtered.accel.z))
gyroxcurve.setData(list(data.filtered.gyro.x))
gyroycurve.setData(list(data.filtered.gyro.y))
gyrozcurve.setData(list(data.filtered.gyro.z))

After hooking input and button events to some functions and passing variables around, the application was working nicely. For the curious individual, the entire source code is available here, and requires Python 2.7 with PyQt, PyQtGraph and PySerial installed.

Playing with Javascript

School productivity

Our Software Design lessons at school have always been competitive, classmates competing for the shortest code, the most interesting project ideas etc. The fruits of one of these unofficial ‘competitions’ though, I think is worth a write-up; the JavaScript Challenge. The challenge was to create animated, interesting graphics in JavaScript using only ASCII characters. Classmates probably wouldn’t be too happy if I stuck their submissions online, hence I’ll only supply my own. With all due modesty though, the nearest competitor was a white spiral generator, which didn’t animate – so you’re not missing out on much :P

take 1. a sine wave

View it here. Quite simple (in comparison), the page consists of a mono-space grid of spaces and digits iterating horizontally using the sine function and a mutated delta value for animation.

Take 2. A Cube

View it here. A big step up, this demonstration uses projection transformation, 3D mathematics and matrices to draw the illusion of a rotating cube.

Basically, the way it works is that each of the cube’s vertices is defined in a stationary position (x, y, z), all stored in a larger array. Each iteration, an angular transform is performed on every point, followed by a distance transformation, then the result displayed on the screen and vertices interpolated between using Bresenham’s line algorithm.

// Perform an angular matrix transform (aint that fun to say :D ), angles in radians.
function AngularTransform( result, original, heading, pitch, bank ) {
 
    for( var i = 0; i != result.length; ++i ) {
 
        // Yes, this is the simplest possible way of doing it ;) -- besides maybe a massive lookup table
 
        result[i].x = (Math.cos(heading)*Math.cos(bank)+Math.sin(heading)*Math.sin(pitch)*Math.sin(bank))*original[i].x +
 
                      (-Math.cos(heading)*Math.sin(bank)+Math.sin(heading)*Math.sin(pitch)*Math.cos(bank))*original[i].y +
 
                      (Math.sin(heading)*Math.cos(pitch))*original[i].z;
 
        result[i].y = (Math.sin(bank)*Math.cos(pitch))*original[i].x +
 
                      (Math.cos(bank)*Math.cos(pitch))*original[i].y +
 
                      (-Math.sin(pitch))*original[i].z;
 
        result[i].z = (-Math.sin(heading)*Math.cos(bank)+Math.cos(heading)*Math.sin(pitch)*Math.sin(bank))*original[i].x +
 
                      (Math.sin(bank)*Math.sin(heading)+Math.cos(heading)*Math.sin(pitch)*Math.cos(bank))*original[i].y +
 
                      (Math.cos(heading)*Math.cos(pitch))*original[i].z;
 
    }
 
    return result;
 
}

Above is the code for the angular transform. It accepts 3 angles in radians, transforming an input vector around the origin by these angles, and then returning the result. The core of the function looks complex, but it is a simply the result of the input vector multiplied by the equation for Euler angles in matrix form.

var px = Math.floor((shape[i].x + offset.x) / (shape[i].z+Z_OFF)*V_DIST) + SIZE_Y/2;
var py = Math.floor((shape[i].y + offset.y) / (shape[i].z+Z_OFF)*V_DIST) + SIZE_X/2;

And those 2 lines perform the distance transformation (generate the view projection), which basically means that objects with a greater Z coordinate look smaller, as they do in reality – A simple inverse relationship between Z and the size of X and Y in relation to zero.

Take 3. A cubefield

View it here. The last piece of graphic JS I worked on, it’s basically a simple extension of the code for the display of a single cube. An array of cubes randomly spawn, Z coordinates decreasing towards the screen until zero and then the cubes respawning. To save processing time, all of the cubes use the same angular transform; hence they are all rotated by the same angle at the same time – but they use a different position transformation and so appear at different positions.

The end?

The code in each of these examples is reasonably commented, and I invite anyone who’s curious to look at all of the page sources and maybe even alter them into something new.. An in-browser 3D space-invaders clone using only ASCII characters would be interesting *nudge nudge.